What is Big Data?
What is Big Data?
Big Data refers to extremely large volumes of data — both structured and unstructured — that are so vast and complex that traditional data processing tools and techniques become inadequate to handle them efficiently.
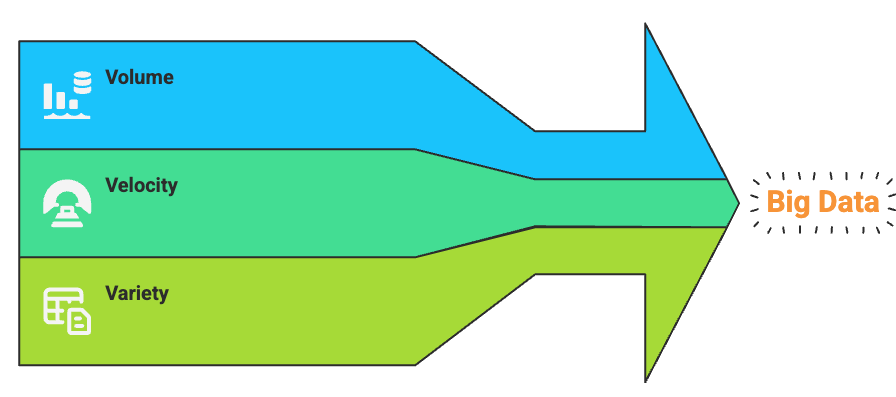
Three V's of Big Data
- Volume: Refers to the enormous amount of data generated every second. Think of data from social media, sensors, transaction records, etc.
- Velocity: Describes the speed at which data is generated, collected, and processed. For example, financial systems and stock markets require real-time data processing.
- Variety: Indicates the many different formats of data — text, images, videos, audio, logs, etc.
Real-Life Example 1: Social Media Platforms
Platforms like Facebook, Instagram, or Twitter generate huge volumes of data daily. Every post, like, comment, and share creates data.
- Volume: Millions of posts, images, and videos are uploaded daily.
- Velocity: Hundreds of Thousands of likes and shares happen every second.
- Variety: Text, images, videos, emojis, and even reactions count as diverse forms of data.
This data is analyzed to show personalized ads, suggest friends, and detect harmful content.
Question:
Why can't a normal spreadsheet like Excel handle social media data?
Answer:
Because Excel has a row limit (around 1 million rows). Social media platforms generate far more than that every minute. Also, Excel is not designed to process videos, images, or real-time data streams.
Real-Life Example 2: E-commerce Websites
Online shopping sites like Amazon handle massive data on user behavior, product searches, inventory, orders, and delivery.
- Volume: Billions of transactions and search logs.
- Velocity: Orders placed every second across the world.
- Variety: Data includes reviews (text), product images, videos, ratings, and clickstreams.
Big Data technologies help recommend products, prevent fraud, and optimize delivery routes in real-time.
Question:
How does Amazon recommend what you might like to buy next?
Answer:
It uses Big Data analytics to analyze your browsing and purchase history along with that of millions of other users to predict and suggest relevant items.
Real-Life Example 3: Healthcare Industry
Hospitals and health apps collect huge amounts of patient data from medical records, wearable devices, and sensors.
- Volume: Millions of patients' data from hospitals and devices.
- Velocity: Real-time heart rate, sugar levels, etc., from smartwatches and fitness bands.
- Variety: Text from prescriptions, images from scans, signals from sensors.
This data is used to detect diseases early, monitor patients remotely, and manage resources like hospital beds efficiently.
Question:
Can Big Data help predict heart attacks?
Answer:
Yes. By analyzing continuous health signals from wearable devices, Big Data models can flag unusual patterns that may indicate a risk, enabling early intervention.
Simple Python Example: Handling a Large Dataset
Let’s try a small Python example to simulate reading a large file with pandas. This is just a demonstration of what tools like Spark handle more efficiently at scale.
import pandas as pd

# Simulating reading a large CSV file (small file for demonstration)
df = pd.read_csv('https://people.sc.fsu.edu/~jburkardt/data/csv/airtravel.csv')

# Show first few rows
print(df.head())

# Basic analytics
print("Total rows:", len(df))
print("Columns:", df.columns.tolist())
"Month" "1958" "1959" "1960" 0 JAN 340 360 417 1 FEB 318 342 391 2 MAR 362 406 419 3 APR 348 396 461 4 MAY 363 420 472 Total rows: 12 Columns: ['"Month"', '"1958"', '"1959"', '"1960"']
Now imagine this file having a billion rows — Excel or traditional scripts would struggle. That’s where Apache Spark helps, as it processes data across multiple machines in parallel.
Summary
Big Data isn't just about size — it's about complexity and speed too. From social media to hospitals, it's being used to make better decisions, faster. As a beginner, understanding the 3Vs and seeing real-world use cases builds a solid foundation before diving into tools like Apache Spark.
Next Topic ⮕3Vs of Big Data: Volume, Velocity, Variety